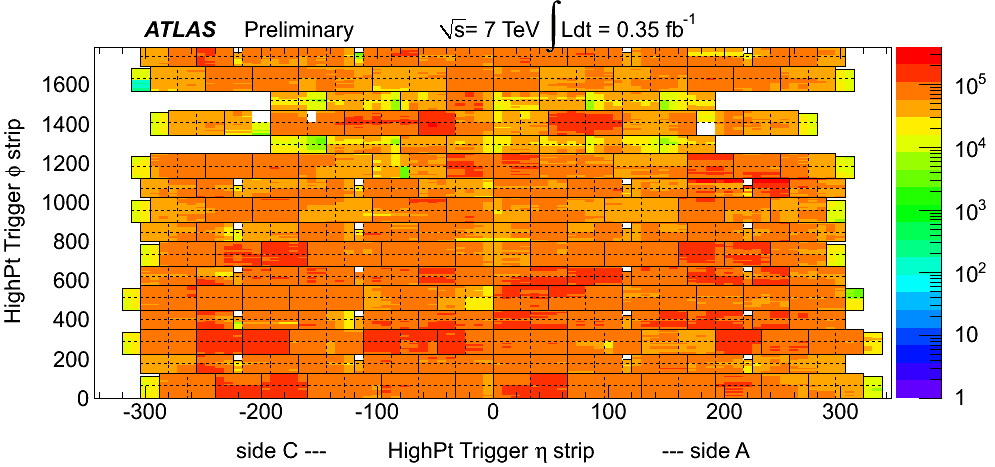
The plot shows the spatial coincidence between eta and phi RPC pivot strips generating a High Pt trigger threshold. Along eta the continuous and the dotted lines are the boundaries between RPC units (equivalent to trigger towers but sector12 and 14 where the first station is split in two trigger towers ) and RPC readout panels (equivalent to trigger ROI but sector12 and 14 where the first station is split in two trigger towers ), respectively. Along phi the continuous and the dotted lines are the boundaries between RPC readout panels (equivalent to trigger ROI but sector12 and 14 where the first station is split in two trigger towers ). The data correspond to periods B2, D, and E of the Muon_Physics stream of 2011 when detector and beam flags were green.
eps png
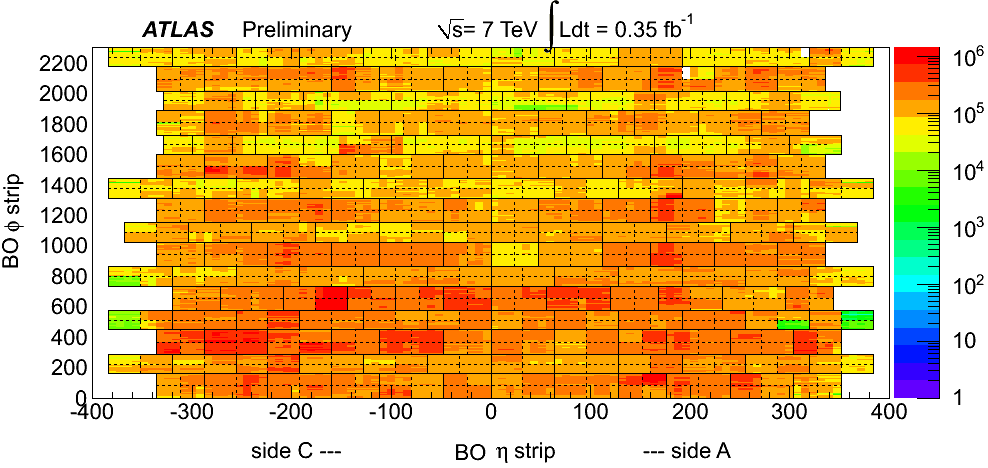
The plot shows the spatial coincidence between eta and phi RPC BO strips for both layers. Along eta the continuous and the dotted lines are the boundaries between RPC units and RPC readout panels, respectively. Along phi the continuous and the dotted lines are the boundaries between RPC readout panels. The data correspond to periods B2, D, and E of the Muon_Physics stream of 2011 when detector and beam flags were green.
eps png
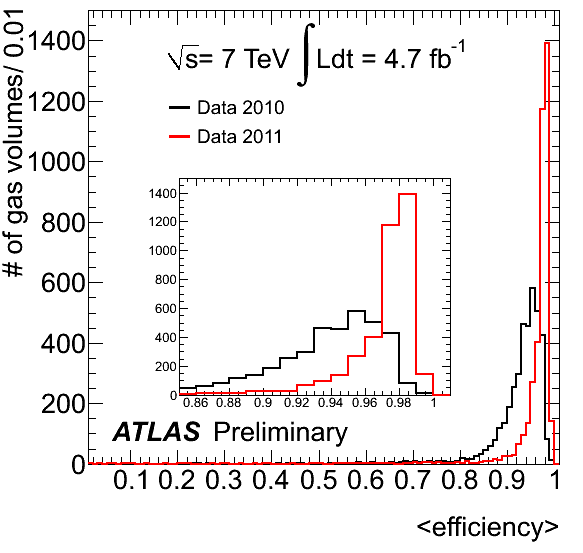
The plot shows the distribution of the measured 2010 and 2011 RPC gas volume efficiencies defined by the positive response of at least one of the two views. The data correspond to all Muon_Physics stream data for both years when detector and beam flags were green.
eps png
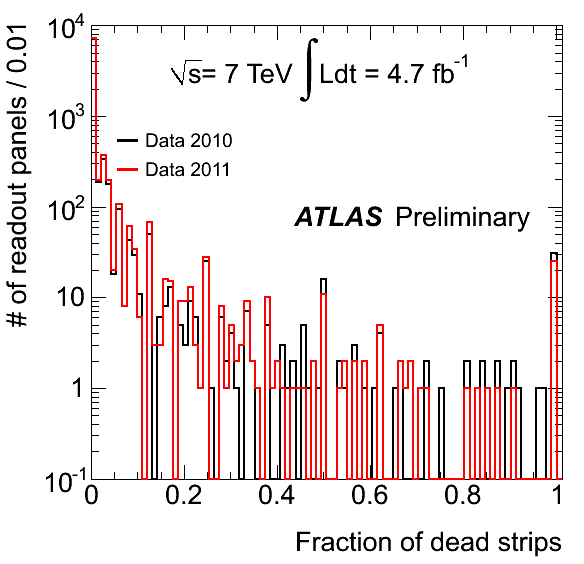
The plot shows the distribution of 2010 and 2011 readout panel dead strip fraction. The data correspond to all Muon_Physics stream data for both years when detector and beam flags were green.
eps png
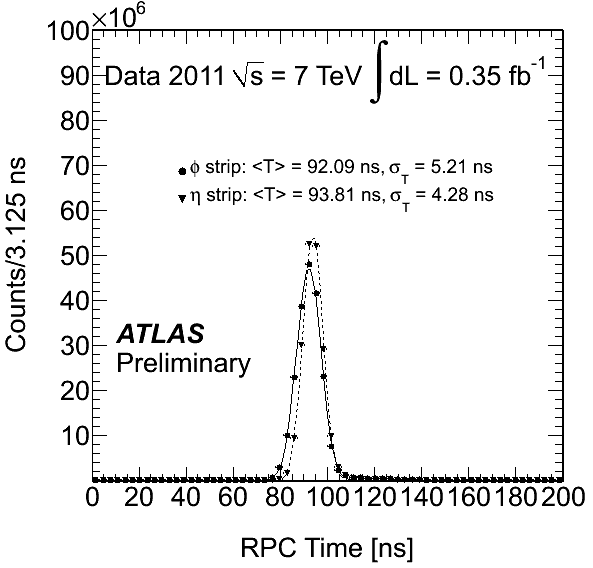
The plot shows the distribution of 2011 RPC time in readout hits for both views. The RPC cluster hit time is defined as the minimum time of adjacent hits. Only cluster hits matched with a muon combined track (dEta<0.1 and dPhi<0.1) are considered. No signal propagation along the strip and off-line time correction are applied. The data correspond to periods B2, D, and E of the Muon_Physics stream of 2011 when detector and beam flags were green.
eps png